GeoServer Rendering Transformations
March 20, 2016
GeoServer Rendering Transformations
Given a large number of vector shapes, GeoServer already does a pretty good job of rendering them. In particular, GeoServer can easily render a vector layer that would cripple Google Earth. Believe me, I’ve done it. It does this by rendering tiles (as images) and then delivering the tiles to the client application. Furthermore, if the tiles have been previously rendered, it can return a cached copy (using GeoWebCache) for optimum performance. So, this is great, but sometimes, just being able to render the layer doesn’t convey any useful information. This is where Rendering Transformations may come in handy.
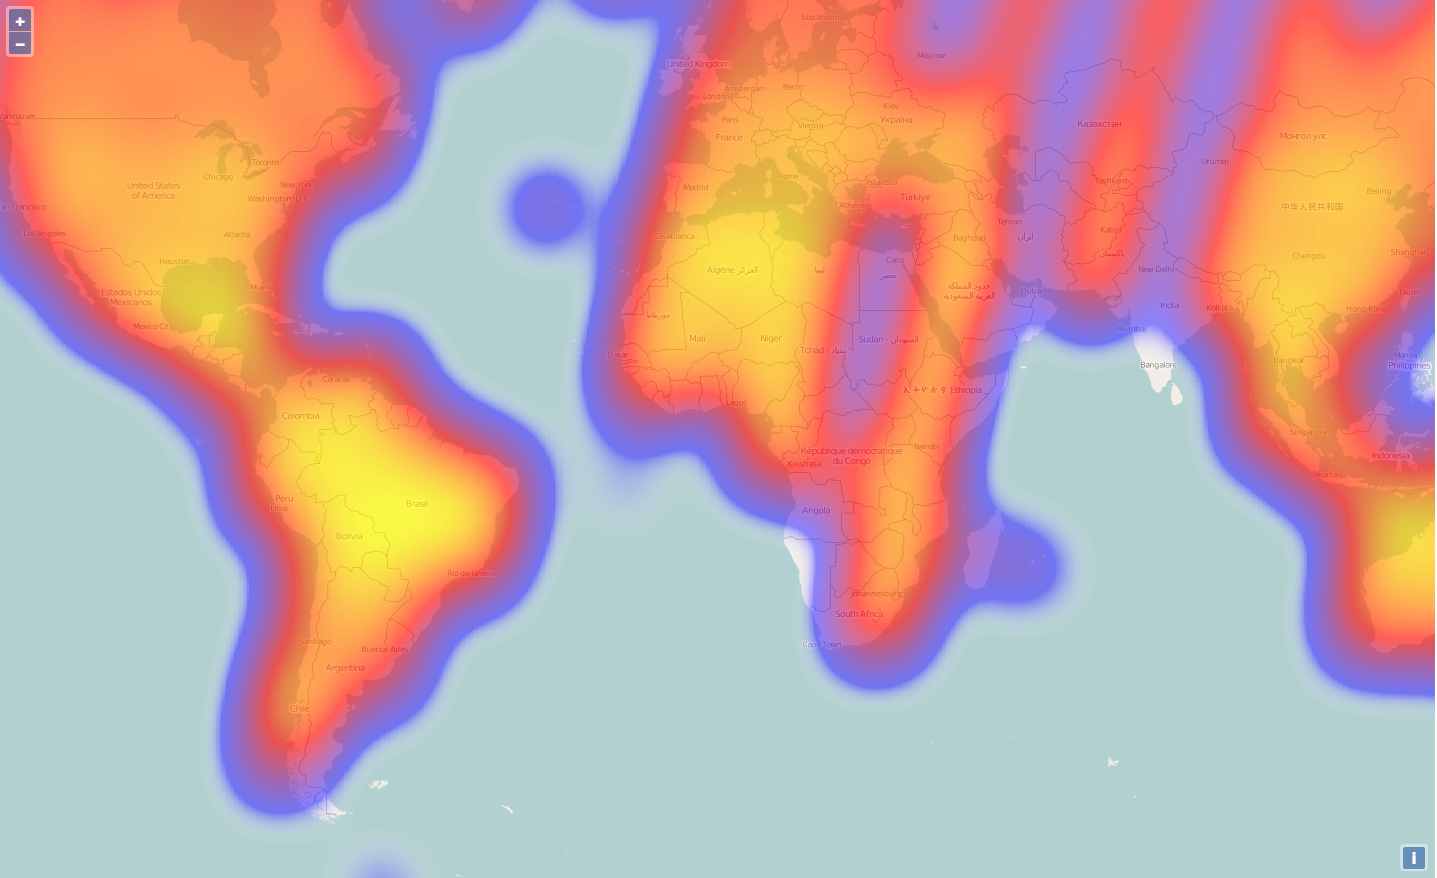
A heatmap representation of observations: an example of a Vector-to-Raster rendering transformation.
A regular Styled Layer Descriptor (SLD) is used to specify how a feature type or layer should be rendered: color, fill, line width, etc. Interestingly, this rendering process can be extended to process the data on request: Vector-to-Vector, Raster-to-Vector, or Vector-to-Raster. As an example of the last type, the heatmap style from the above example calculates the density of features according to the parameters passed to the heatmap function in the SLD. The resulting values are used to fill in a grid coverage (i.e., raster) and displayed according to a color ramp, also specified in the SLD. Note that in order for the layer to render correctly, you have to specify that you want a single tile (rather than a regular tiled layer).
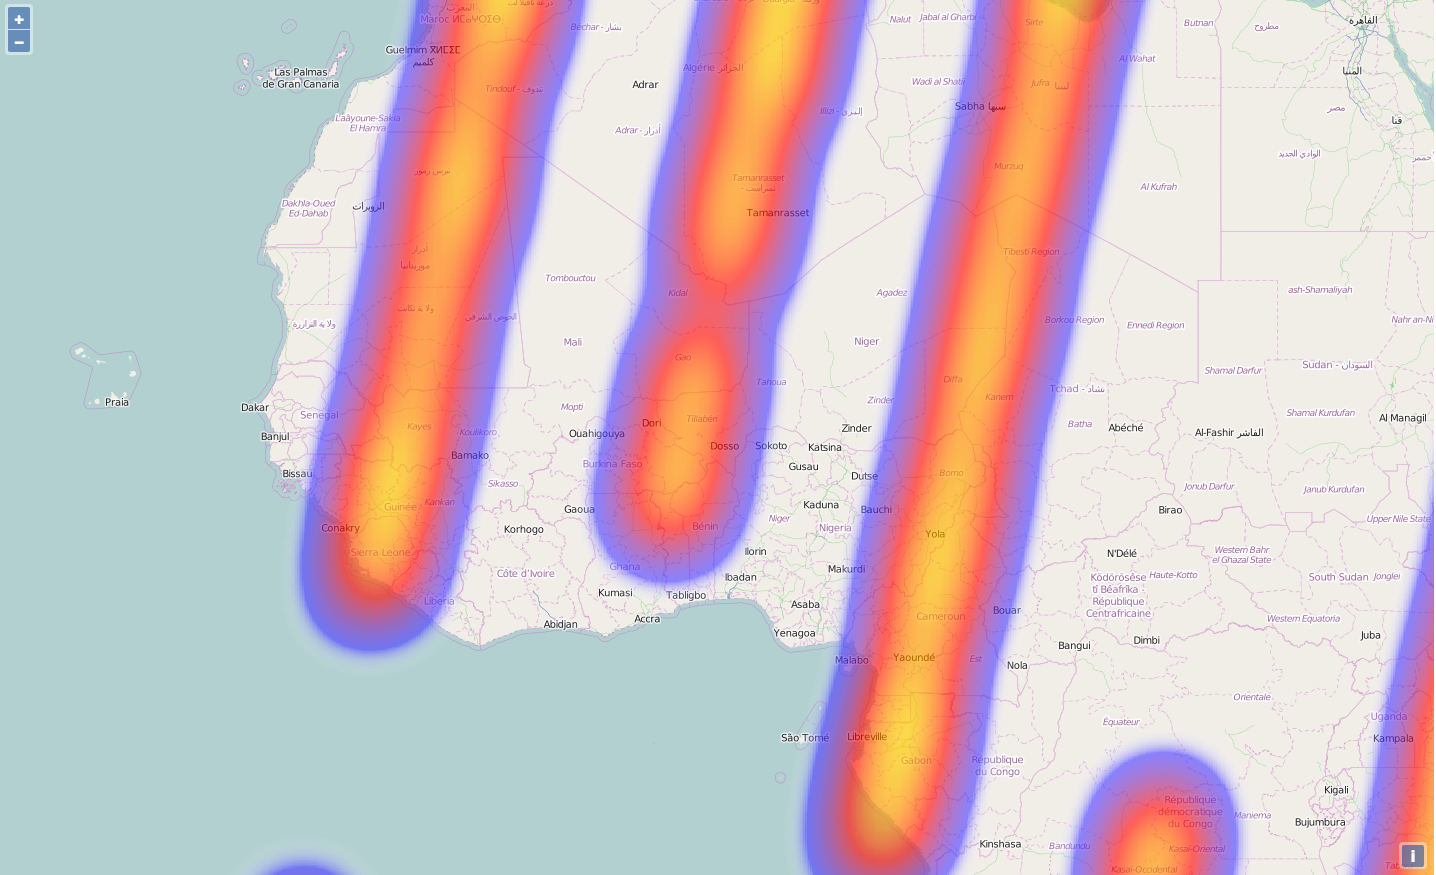
The rendering transformation is re-applied for the current view… resulting in increased detail on zoom.
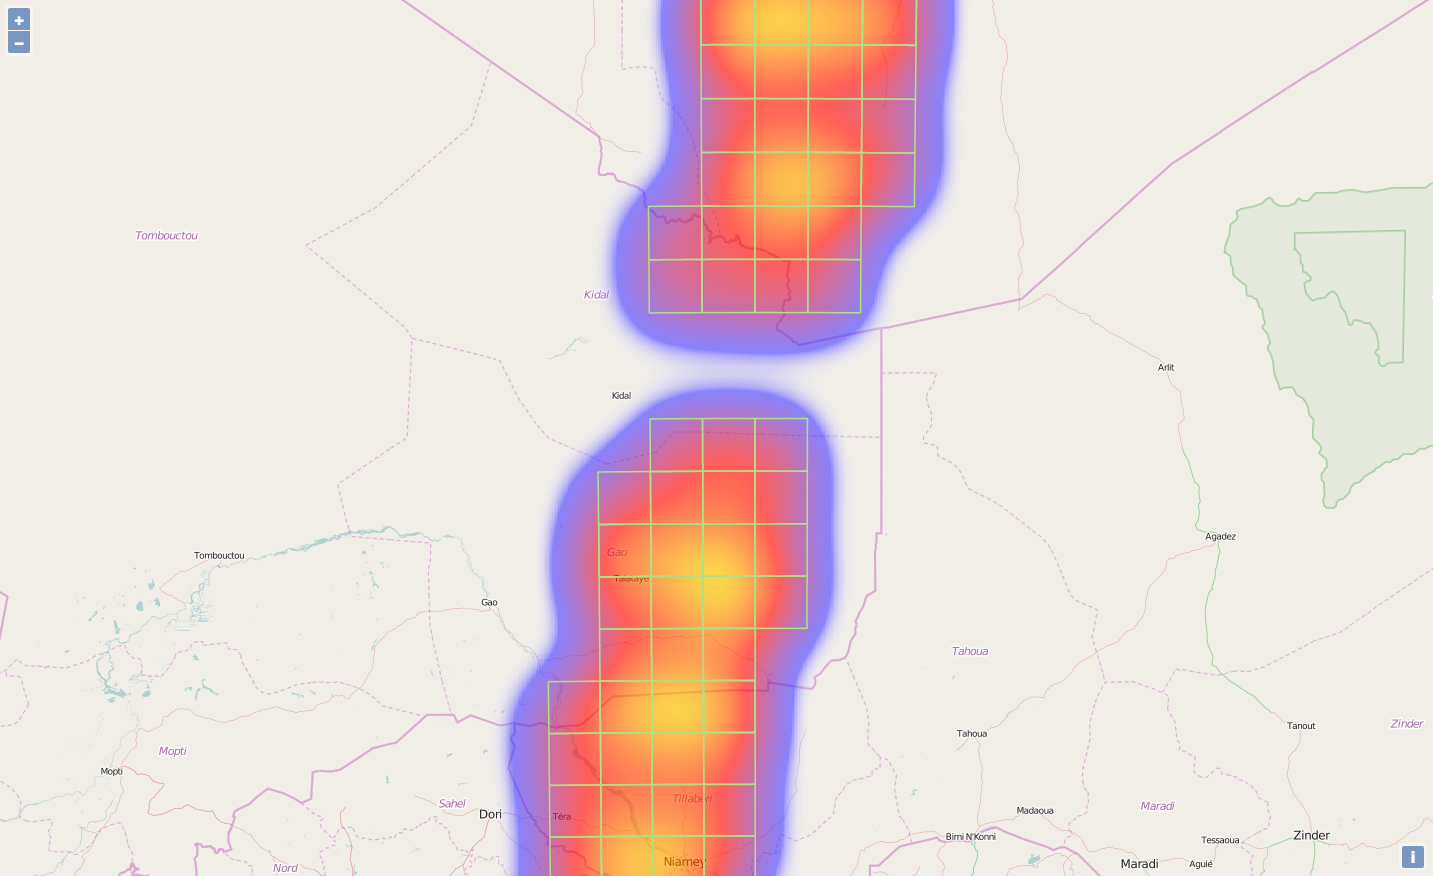
The heatmap style depends on being able to calculate a density. As a consequence, it becomes somewhat less useful once you have zoomed in enough to easily distinguish individual features. So, it makes sense to switch to a regular SLD at that point. While I appreciate the robust capabilities of SLDs, the XML schema can be somewhat daunting and prone to error. Fortunately, another incredibly awesome feature of GeoServer exists: css styles. This allows you to define styles in a much more developer friendly way. The css gets converted internally to SLD, so you can always tweak the XML if needed. For example, to display a grid of actual observations once you have zoomed in far enough, this is all that is required:
_[@scale < 10000000] {
width: 1;
stroke: ‘#b2df8a’;
}_
The regular renderer turns on when it makes sense… also gives some indication of how the heatmap is calculated.
All of the GeoServer Rendering Transformations are built on top of the web processing service plugin, so be sure to install that first. A great example of a Vector-to-Vector transformation is the PointStacker style from the OpenGeo Suite documentation. Finally, while there seems to have been some discussion around it, rendering transformations are not quite supported by the css style plugin as far as I can tell.
Written by aliasmrchips next to the Rio Grande in Northern New Mexico. You can follow me on Twitter


